Feb 2020
Data Source: Inside Airbnb
Tag: Data Science
Introduction:
Airbnb, as an online platform for arranging or offering lodging, has become a more and more popular approach for people hoping to make extra cash out of their homes. Before listing their apartments, homes, living room sofa, etc. as shopping goods online, people are usually wondering how much their listing is worth per stay and how to aim for a higher price. In this analysis, I will provide some insights based on statistical research here to help people make the decision on their Airbnb price, especially in Seattle and Boston.
Part One: What is the listing price usually like?
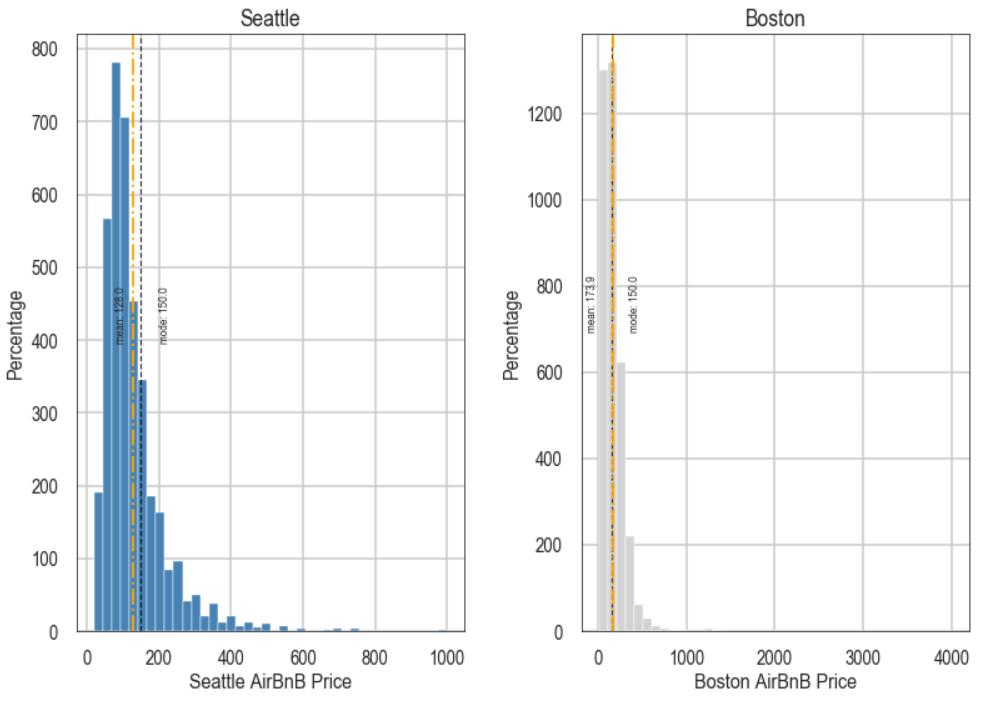
Comparing the Seattle and Boston listing prices, we could see the average Seattle listing price in Seattle is $129, while the average price in Boston is $173. However, the average price is not always the most representative number for the most common price in the market. Let’s take a look at the chart below, we could see the listing prices range from $0 to $1000 in Seattle, while $0 to $4000 in Boston, but the most common prices in Seattle and Boston Airbnb are both $150. So if you have a plan to list an Airbnb on your own in either of these cities, $150 would be the most general expectation.
Part Two: Where do the high listing price properties locate?
Now we what the general listing price distribution looks like, but what characters do the high price listing share in common? For example, the locations, house, and room types?
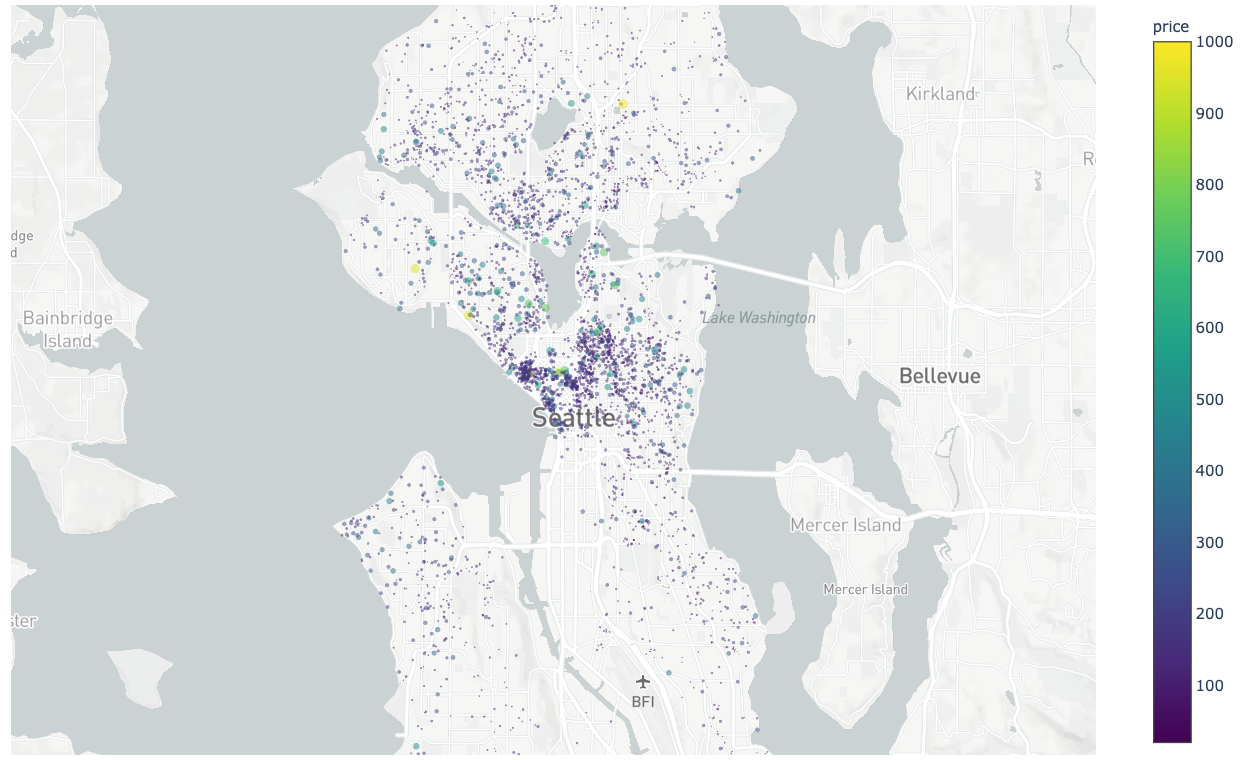
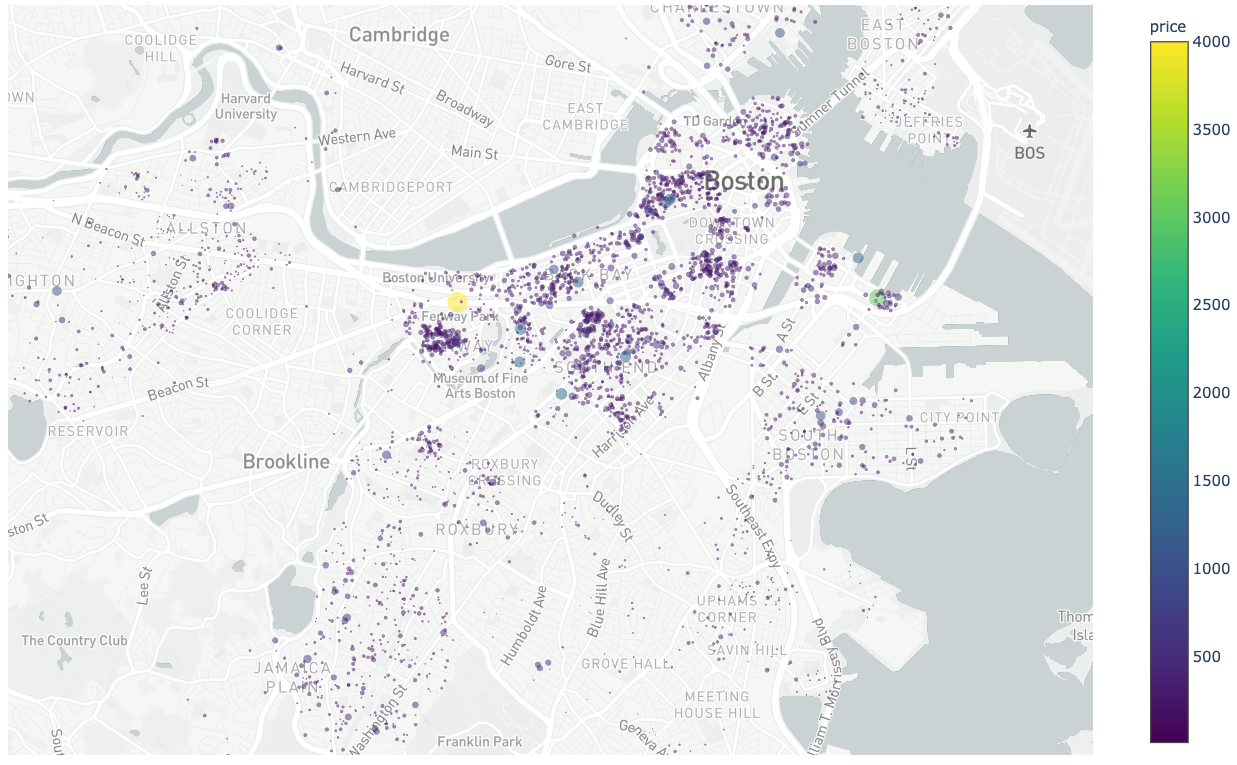
Here are two maps that show locations of Airbnb and the prices in Seattle and Boston. The higher the price is, the bigger and lighter a point is. We can see that in Seattle, the high price listings mainly cluster in downtown Seattle, Capitol Hill, East Lake, and Lower Queen Anne. Similarly in Boston, downtown Boston and around Boston University are hotspots after excluding the outliers.
If your property is in any of these neighborhoods, you are likely to get a higher listing price.
Part Three: What type of property has a higher listing price?
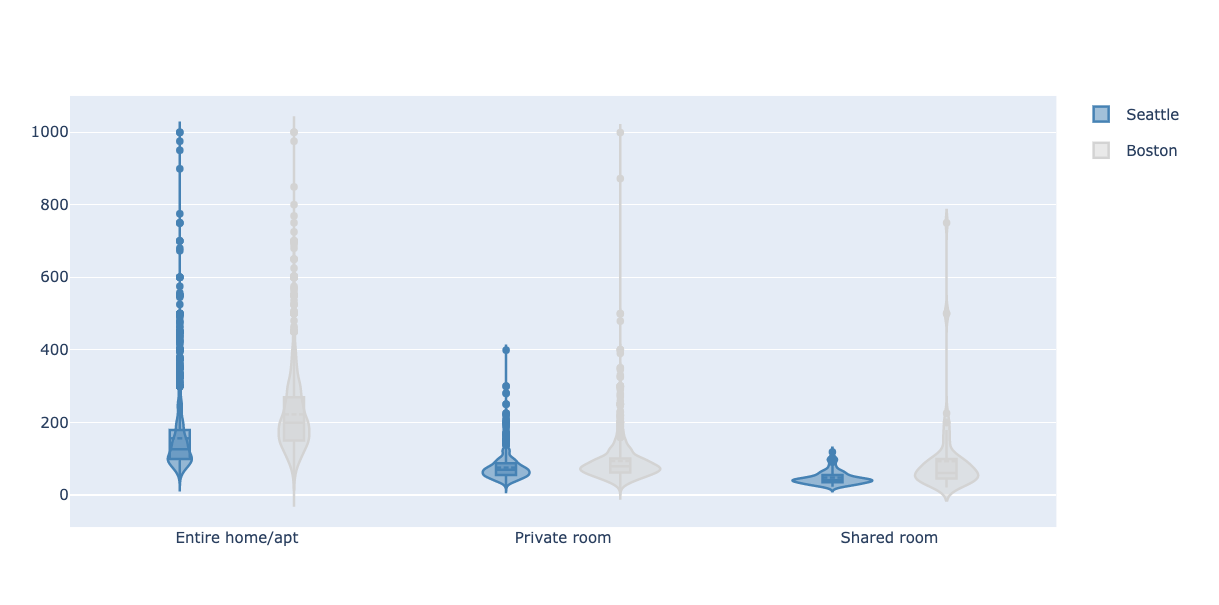
What type of property usually has a higher price? Here is a chart shows the comparison between the three property types: Entire home/apt, private room and shared room. The rectangle in the middle of each blob represents the most common price for each property type category. We can see that the entire home or apartment types have the highest price, the private rooms are the second, and the shared room has the lowest price.
Part Four: What are the most important factors related to the listing price?
If we put all the factors related to Airbnb pricing, including property characters, host information, reviews, amenities, etc, we can see the top 20 important factors are most about property type and location. That is to say, the location and property type have mostly already decided your listing price.
But what if your property is not an entire home or apartment, or even a private room, and not in a good location? The answer is to try to be more responsive. You could possibly have a higher listing price!
Conclusions
In this article, I took a look at the listing price distribution, location, property type categories and the most important factors related with listing price according to the Airbnb data in Seattle and boston.
1. I gathered the mean and mode of both markets and came with the conclusion that the most common price is $150.
2. I then looked at the spatial distribution. The high listing price usually clusters at some local hotspots.
3. Next, I looked at the price distribution within each property type and there is a clear pattern that entire department or houses are higher than private rooms, and shared rooms usually have the lowest price.
4. Finally, I looked at the top 20 factors associated with price. Although most of them are location and property type predictors, the host response rate is also a powerful factor. So a high response rate could be a good strategy to aim for a higher listing price.
Next Steps and Limitations: The final top 20 factors prediction is only using the Seattle Airbnb dataset. In the next step, I will either train a different model on Boston Airbnbs to compare the differences or apply the Seattle model on Boston to see if the prediction is generalizable.