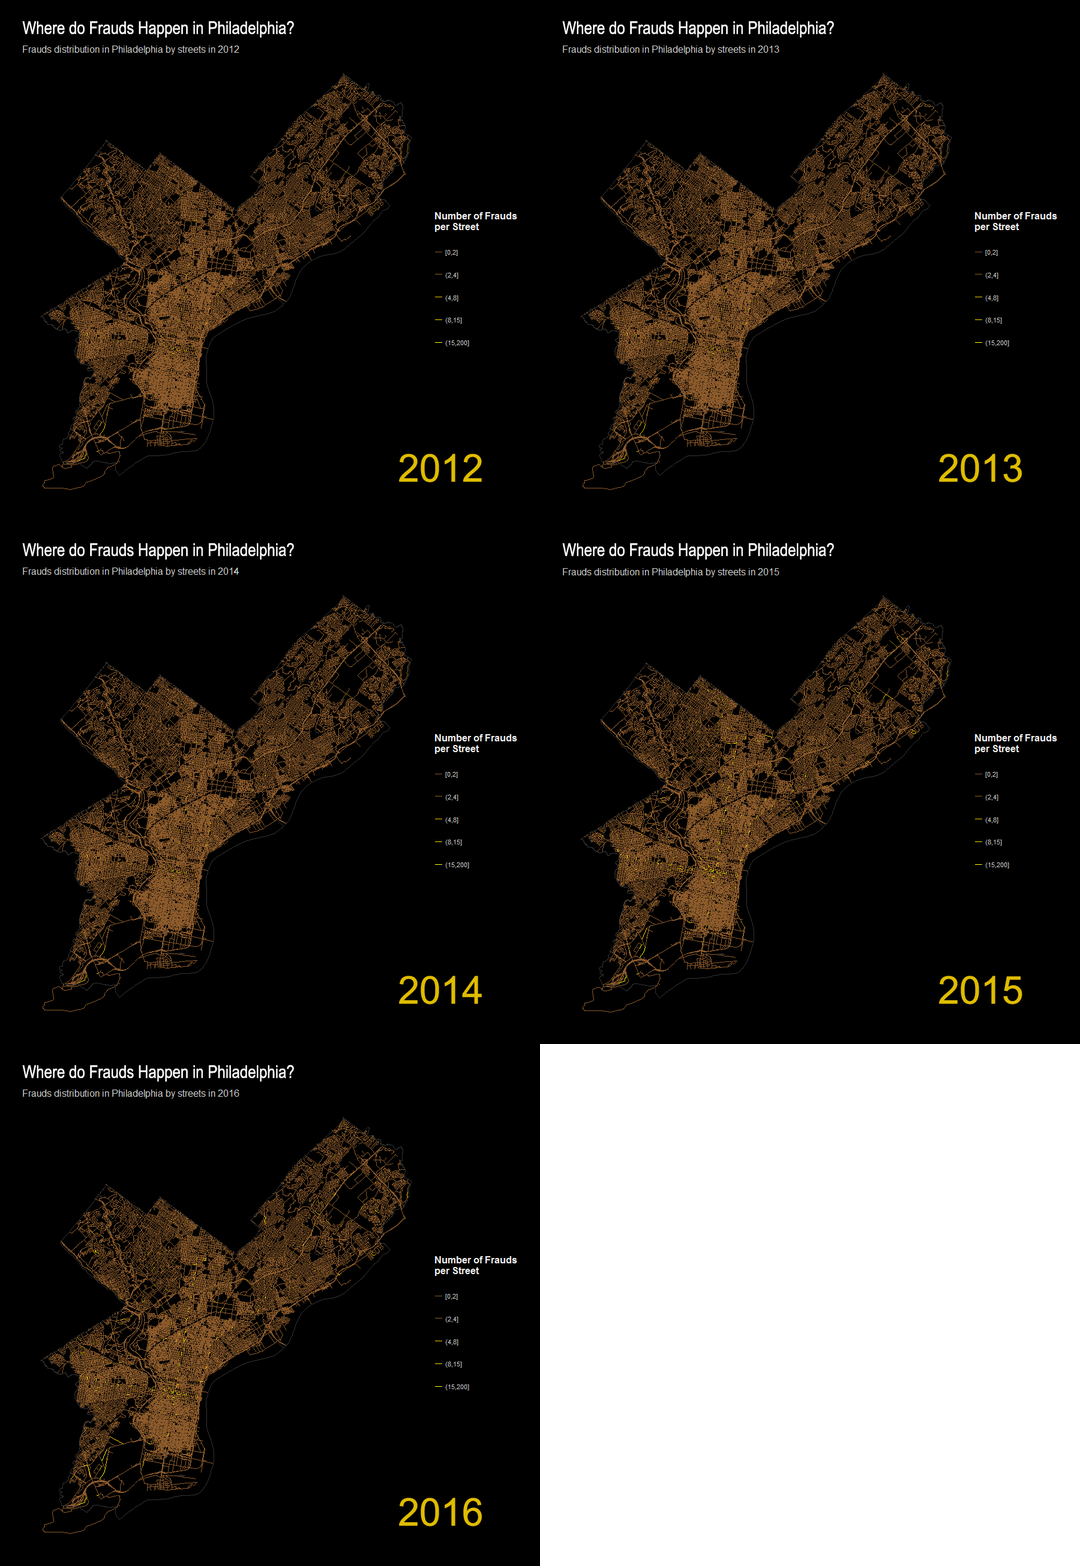
Where Do Frauds Happen in Philadelphia?
The reason for choosing fraud is because this is the type of crime that people usually ignore from violent crimes, but it is the most common type of crime no matter where, when or who. I decided to use this type of crime hoping people could pay more attention to it in the future.
The creation of this map took three main steps. The first step is to load the data of crime and street centerline data into R. After selecting the data type of fraud and cleaning the null values in longitude and latitude, the ten-year crime data with is ready for calculating the distances from the closest street segment. In this step, we used a spatial query to calculate the distance of each crime point to the street segment within 1000 meters, and take the minimum of all the distances through assigning them in a descending order. The second step is to load the first step spatial query table and join it together with the street segment using the street ID and count the number of crimes happened on that street. The last step is to create a map of the number of frauds on each street using a color palette.
This map shows that central city in Philadelphia has the streets with the most frauds. The cluster of these frauds might be related with the number of people working on that street, the size of the neighborhood that street is located, the type of architecture on that street and maybe the number of aliens or tourists on that street. When observed much closer, we can obviously see from the map that main street connecting central city together with West Philadelphia, the market street and the broad street which connect the north of the city together with the south of the city all have continuous high numbers of frauds from 2012 to 2016. And the number of frauds on these two streets also have a trend of increasing. That also indicates that the Market Street and the Broadway might be the most dangerous streets of fraud in Philadelphia.
Data Sources: https://www.kaggle.com/mchirico/philadelphiacrimedata/version/19