Where are the Monarch Butterflies?
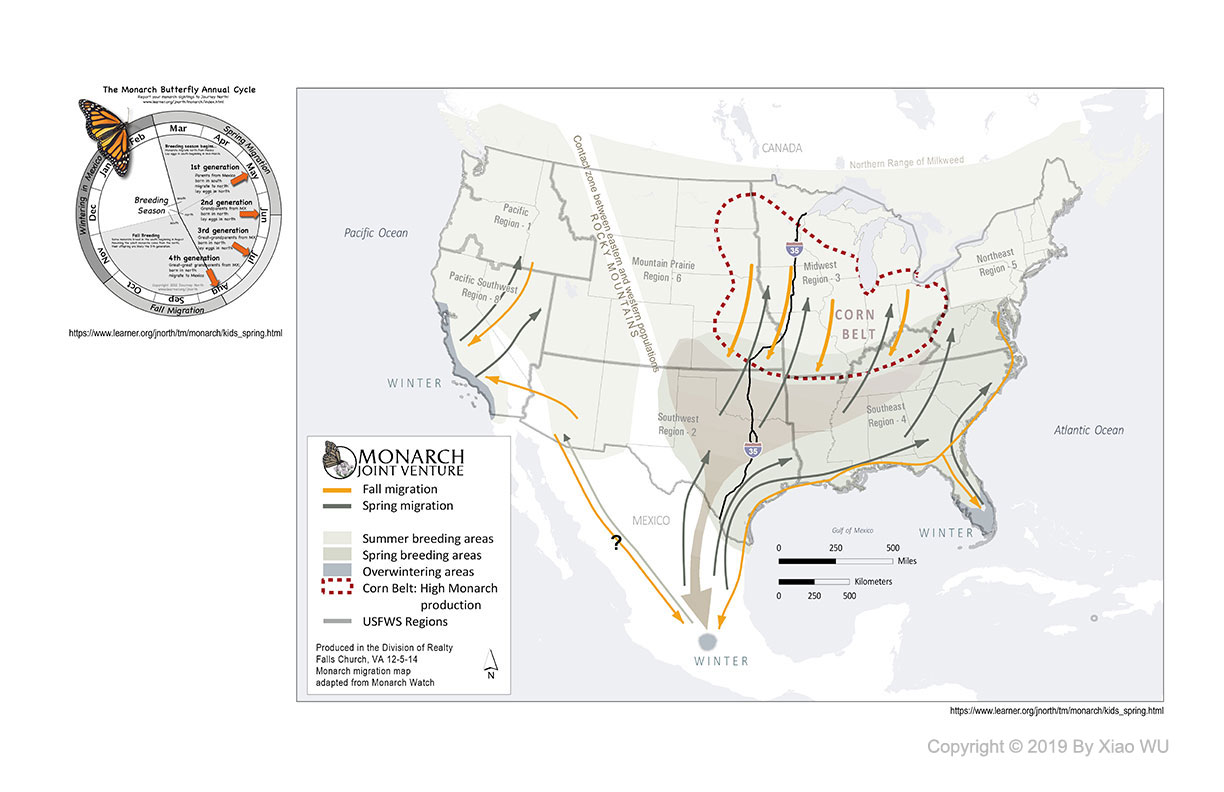
The North American monarch population is notable for its annual southward late-summer and autumn migration from the northern and central United States and southern Canada to Florida or Mexico. Their migration corridors are the one along the west coast, the one in the center of the states crossing the corn belt and the one along the east coast. These migrations happen twice a year accomplished by four generations of Monarch Butterflies. Although these are the three mainly recognized migration corridors that Monarch Butterflies show up the most, their Migration pattern slightly changes every year because of the land cover change, climate and etc. There is a lot of citizen science data online reporting about the spots where they are found every year.
This kind of butterfly is also mostly recognized as an iconic pollinator species. A study in 2016 showed that Monarch Population decreased to one-tenth in the last decade due to the loss of breeding habitat. The aim of this research is to examine the Monarch population change throughout time and space, and also explore the relationship between monarch migration pattern change and vegetation change.
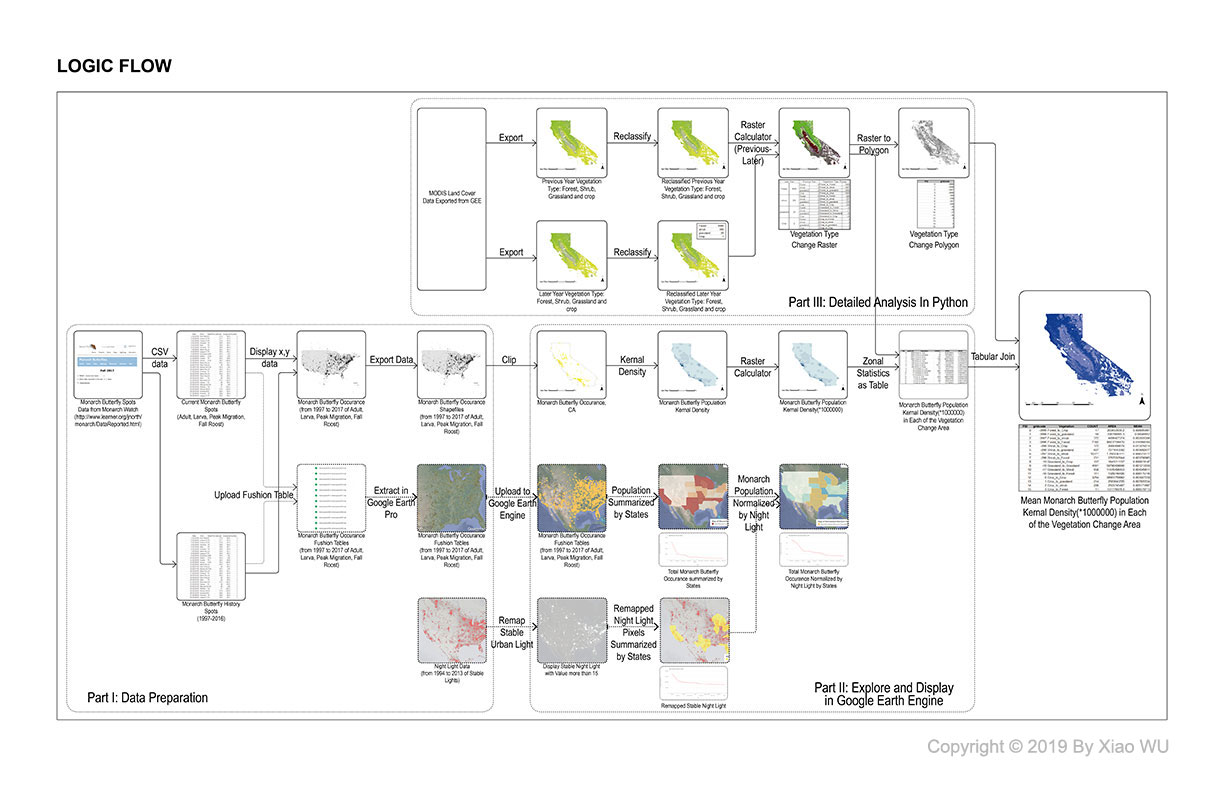
In terms of data, in this analysis, the citizen science data from Monarch Watch would be used as the main data for analyzing their migration pattern and population change throughout time and space. This research will include a time span of 1997 to 2017. The first part of the research is about preparing the data for analysis, downloading the data from Monarch Watch as CSV and export them as shapefiles using Python.
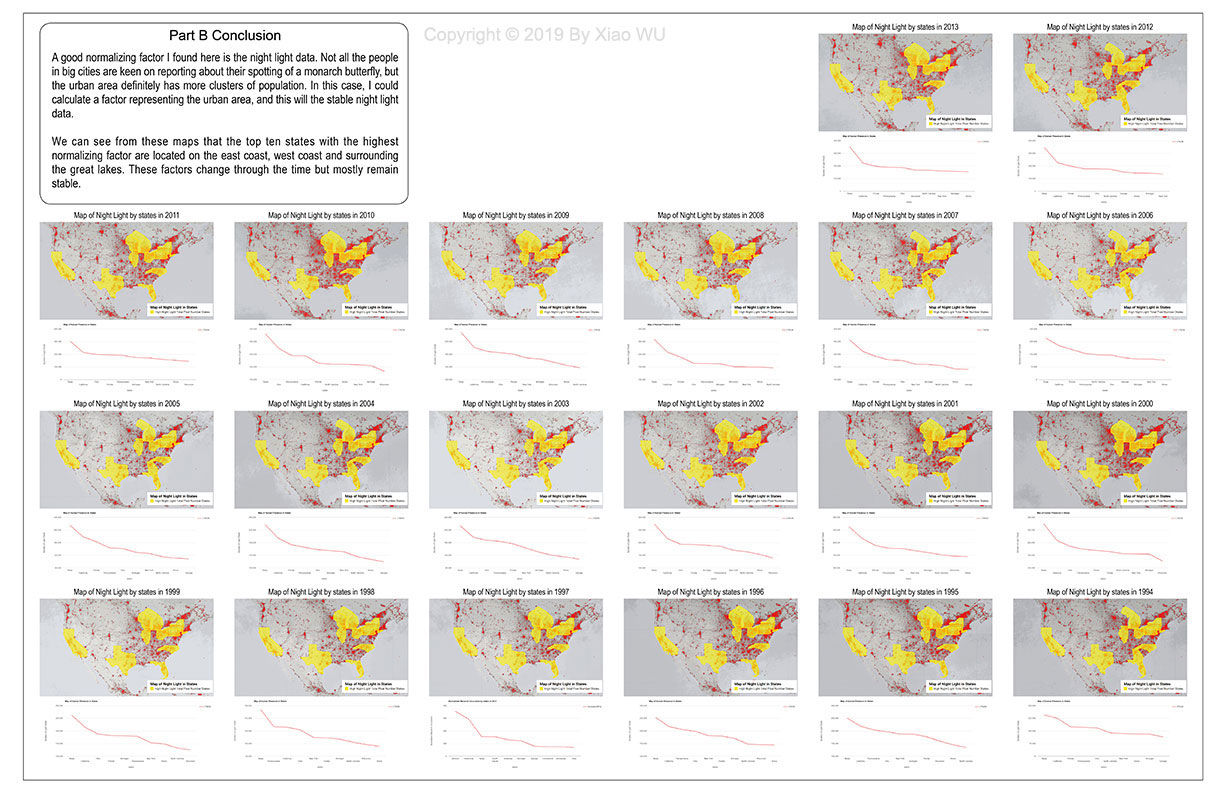
In the range of space, the total Monarch population in states will be summarized to see if they are migrating in the way that ecologists suggest. I will also try to normalize the total monarch population to decline the effect that they are spotted because of human presence. The states with the most Monarch Butterfly population or normalized Monarch Butterfly population will be highlighted in the maps, therefore, an actual monarch migration or presence corridor would be clearly displayed in the United States.
In the range of time, because the number of observations of Monarch Butterfly might be unreasonable to be compared throughout the years, the rankings of one state among all the states is still possible to be compared in this research. So that the comparison in the time range is done using this method.
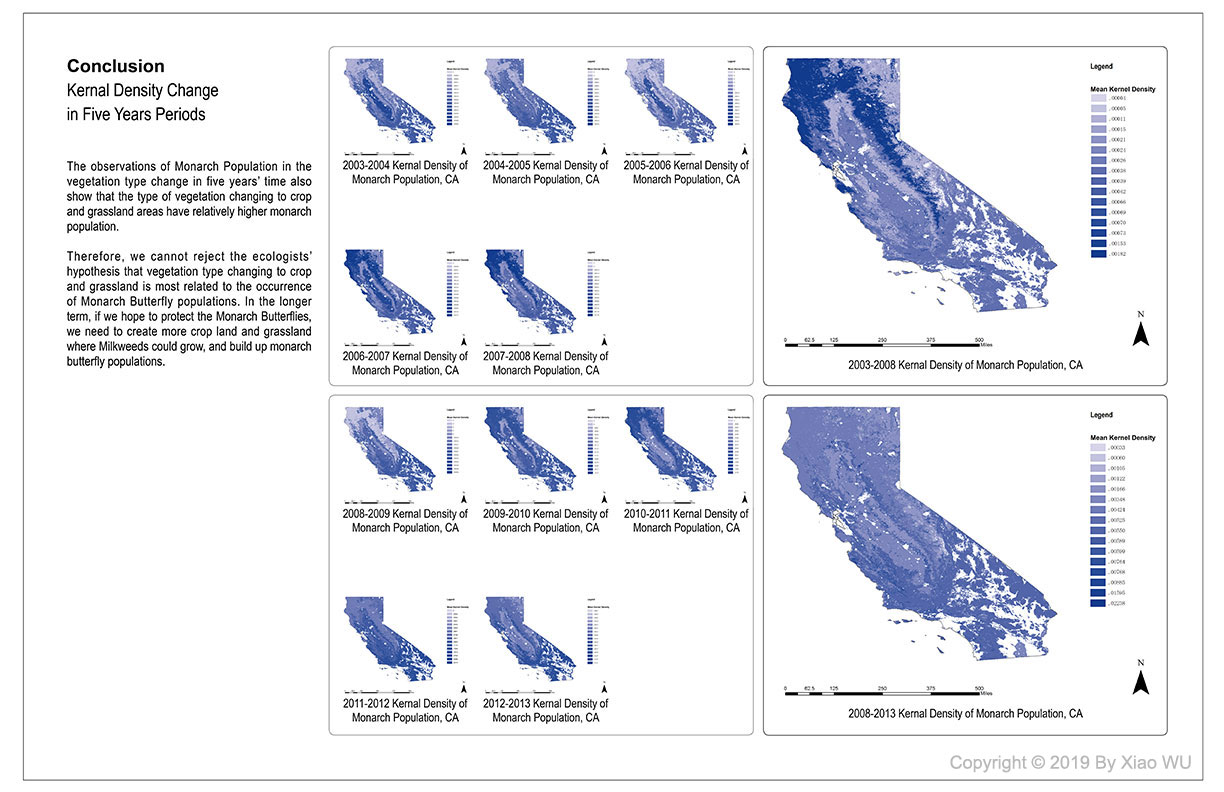
After examining their migration pattern and population change, a brief analysis related to land cover based on MODIS data will also be included in the third part of the analysis to explore which kind of landcover change is related to the monarch population the most. By calculating the mean kernel density of each type of landcover change, the relationship between Monarch Butterfly population and land cover type change would also be discussed.